
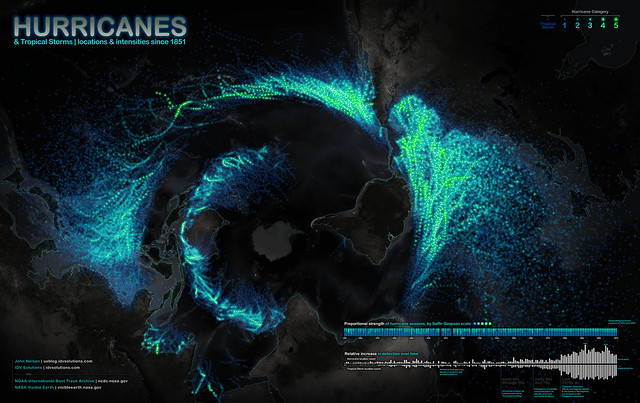
We are looking at the world from the bottom up. Antarctica is in the center. The larger semicircle follows the equator. The grayish bar graph in the lower left corner shows the number of hurricanes (above the axis) and tropical storms (below the axis) detected. Satellites have improved our detection rate, or at least those detections are now being recorded. All those guys who got caught in storms at sea before we had satellites, well, they detected the storm, but a lot of them didn't survive to report it.
Via How-To-Geek.


No comments:
Post a Comment